Saturday, July 10, 2010

Recession Frequency Was Much Higher Pre-1990

There have been a lot of comparisons of the most recent recession to the Great Depression and to previous post-WWII recessions, for example see the Minneapolis Federal Reserve's website on The Recession and Recovery in Perspective.  While most comparisons have been between the length and severity of the 2007-2009 recession to previous individual recessions, what has received considerably less attention is the frequency of recessions over various periods of time.  That is, it's not only the length and severity of individual recessions that is important, but it's also important how frequently recessions occur over periods like 8, 10 and 12 year periods. 

The top chart above shows the frequency and duration of the 12 recessions since WWII, according to the NBER.  Using "inter-ocular least squares analysis" (i.e. "eyeballing" the data), it seems pretty clear that recessions were much more frequent in the: a) mid-1940s to early 1960s period, and b) early 1970s to early 1980s period, than in the post-1982 period.  Maybe one of the reasons the most recent recession seems particularly severe is that we "got spoiled" in the 25-year period between 1983 and 2007, when the economy was in recession only 6.3% of the time, compared to the previous 25-year period when the economy was in recession 23% of the time from 1958 to 1982. 

The next three charts show the percentage of months in recession over: a) rolling 8-year periods, b) rolling 10-year periods, and c) rolling 12-year periods.  Over the most recent 8-year period (July 2002 to June 2010), the economy has been in recession 20% of the time, down from 25% a year ago.  In contrast, the economy was in recession 20% or higher during 62% of the 8-years rolling periods between 1953 and 1989.  Similar patterns emerge for the 10-year and 12-year rolling periods: the economy was in recession much more frequently between the 1950s and 1990 compared to the post-1990 period, and we definitely got "spoiled" in the 1990s and 2000s, with long periods of time during which the economy was expanding, not contracting. 

For example, over 12-year periods, the economy was in recession for only 6.25% of the time for more than half of the 1990s and  half of the 2000s, representing the longest periods of ongoing economic expansion since WWII. So not only has the most recent recession been less severe than some of the previous recessions by certain measures like the maximum unemployment rate, but the recession frequency during the most recent 8-, 10- and 12-year periods has been much lower than the pre-1990 period.  

Bottom Line: It could be a lot worse, and in fact when it comes to the frequency of recessions, it was a lot worse in much of the 1950s, 1960s, 1970s and 1980s than recently in the 1990s and 2000s.

U-Haul Index: LeBron's Not the Only One Leaving

One-way rental rates for a 26-foot U-Haul truck on August 4, 2010:

Miami, FL to Cleveland, OH: $1,000
Cleveland, OH to Miami, FL: $1,457
Premium to leave Ohio: 45.7%

Orlando, FL to Cleveland, OH: $834
Cleveland, OH to Orlando, FL: $1,301
Premium to leave Ohio: 56%

Tampa, FL to Cleveland, OH: $917
Cleveland, OH to Tampa, FL: $,1379
Premium to leave Ohio: 50.4%

Assuming that one-way U-Haul rates are based on relative demand, there are lot more people and trucks leaving Ohio for Florida than vice-versa, resulting in large premiums to rent trucks going to Florida and large discounts for trucks going to Ohio. 

Section 342 of the Dodd-Frank Bill Will Impose Gender and Racial Quotas on the Financial Industry; Even Though the House Committee is 82% Male, and the Senate Committe is 96% Male, 100% White

Here's something that has great potential to ruin your day, from Diana Furchtgott-Roth:

"Section 342 of the Dodd-Frank financial regulation bill declares that race and gender employment ratios, if not quotas, must be observed by private financial institutions that do business with the government. In a major power grab, the new law inserts race and gender quotas into America's financial industry.

In addition to this bill's well-publicized plans to establish over a dozen new financial regulatory offices, Section 342 sets up at least 20 Offices of Minority and Women Inclusion. This has had no coverage by the news media and has large implications.

The Treasury, the Federal Deposit Insurance Corporation, the Federal Housing Finance Agency, the 12 Federal Reserve regional banks, the Board of Governors of the Fed, the National Credit Union Administration, the Comptroller of the Currency, the Securities and Exchange Commission, the new Consumer Financial Protection Bureau...all would get their own Office of Minority and Women Inclusion.

Each office would have its own director and staff to develop policies promoting equal employment opportunities and racial, ethnic, and gender diversity of not just the agency's workforce, but also the workforces of its contractors and sub-contractors.

What would be the mission of this new corps of Federal monitors? The Dodd-Frank bill sets it forth succinctly and simply - all too simply. The mission, it says, is to assure "to the maximum extent possible the fair inclusion" of women and minorities, individually and through businesses they own, in the activities of the agencies, including contracting.

Lest there be any narrow interpretation of Congress's intent, either by agencies or eventually by the courts, the bill specifies that the "fair" employment test shall apply to "financial institutions, investment banking firms, mortgage banking firms, asset management firms, brokers, dealers, financial services entities, underwriters, accountants, investment consultants and providers of legal services." That last would appear to rope in law firms working for financial entities.

This latest attempt by Congress to dictate what "fair" employment means is likely to encourage administrators and managers, in government and in the private sector, to hire women and minorities for the sake of appearances, even if some new hires are less qualified than other applicants. The result is likely to be redundant hiring and a wasteful expansion of payroll overhead.

With the new financial regulation law, the federal government is moving from outlawing discrimination to setting up a system of quotas. Ultimately, the only way that financial firms doing business with the government would be able to comply with the law is by showing that a certain percentage of their workforce is female or minority.

The new Offices of Women and Minorities represent a major change in employment law by imposing gender and racial quotas on the financial industry. The issue deserves careful debate - rather than a few pages slipped into the financial regulation bill."

MP: As Thomas Sowell reminds us: If there is ever a contest to pick which word has done the most damage to people's thinking, and to actions to carry out that thinking, my nomination would be the word "fair."

Update: Gender composition of The House Committee on Financial Services, chaired by Barney Frank: 

Male: 81.7%
Female: 18.3% (only 13 female members out of 71)

Gender composition of the Senate Committee on Banking, Housing and Urban Affairs:

Male: 96% (all white)
Female: 4% (only one white female member out of 23)
Minorities: 0%

Friday, July 9, 2010

Markets in Everything: Dollars for Domains

The chart above shows the top ten highest reported domain sales in 2010, see the full list of the top 100 here


Here's a recent CNBC segment about the market for domain names:

Canada Recovers Almost All Jobs Lost in Recession


Statistics Canada -- "Employment rose by 93,000 in June, pushing the unemployment rate down 0.2 percentage points to 7.9%. This is the first time the rate has been below the 8% mark since January 2009.  Employment has been on an upward trend since July 2009, increasing by 403,000 (+2.4%). These gains offset nearly all the employment losses observed during the labour market downturn which began in the fall of 2008. The June unemployment rate, however, remained well above the October 2008 rate of 6.2%, due to a large increase in the number of people in the labour force over this period."

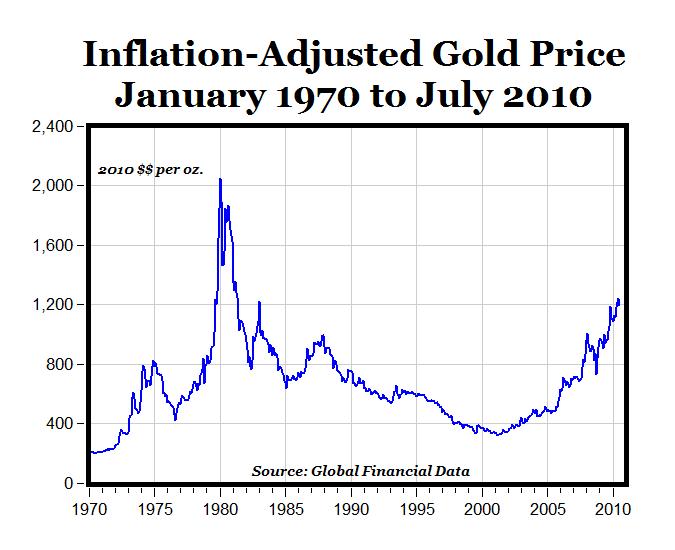
Chart of the Day: Real Gold Prices

Adjusted for inflation, the price of gold today is 41.5% below the January 1980 peak of more than $2,000 per ounce (in 2010 dollars). 

Chart of the Day: Net Interest Margin

The net interest margin for all U.S. banks of 3.82% in the first quarter of 2009 is the highest since the fourth quarter of 2002.